
COOP Careers Captain Dashboard
Overview
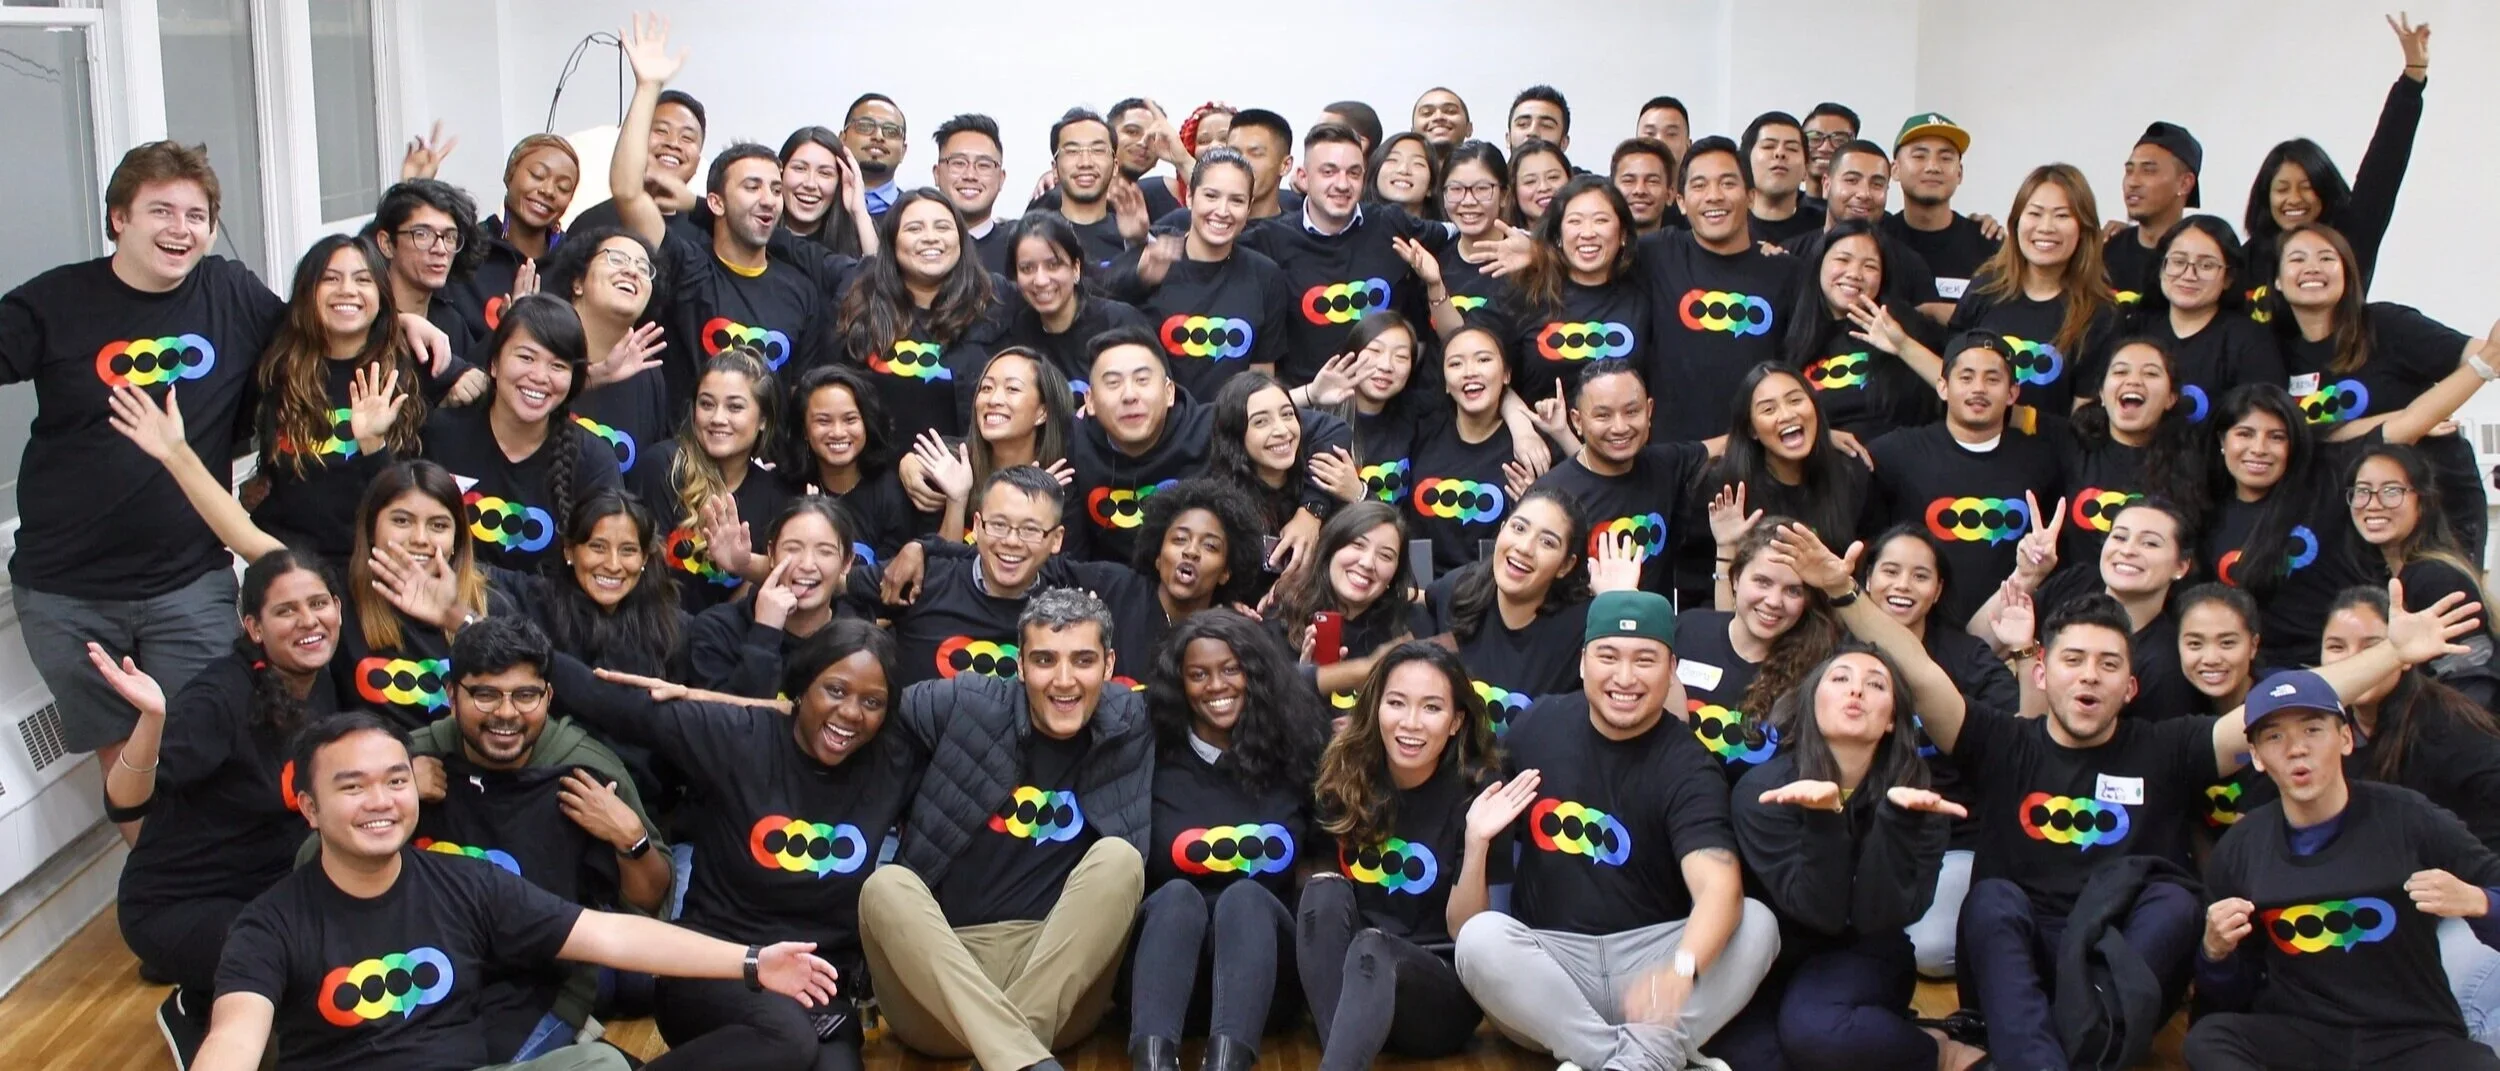
COOP Careers (backed by Google) is a nonprofit fellowship that helps first-generation and low-income college graduates break into professional careers through a 16-week, cohort-based program in Digital Marketing, Data Analytics, and Financial Services. I went through the program myself in 2017 in San Francisco, at the very start of my career. COOP gave me the skills to land my first role as a Paid Search Analyst, learning resources I couldn't have afforded otherwise, and a community of peers to grow with.
In 2020, I transitioned into product design. And the further I got into my design career, the more I thought about what COOP's learning experience could look like if it were intentionally designed, not just as a program, but as a product.
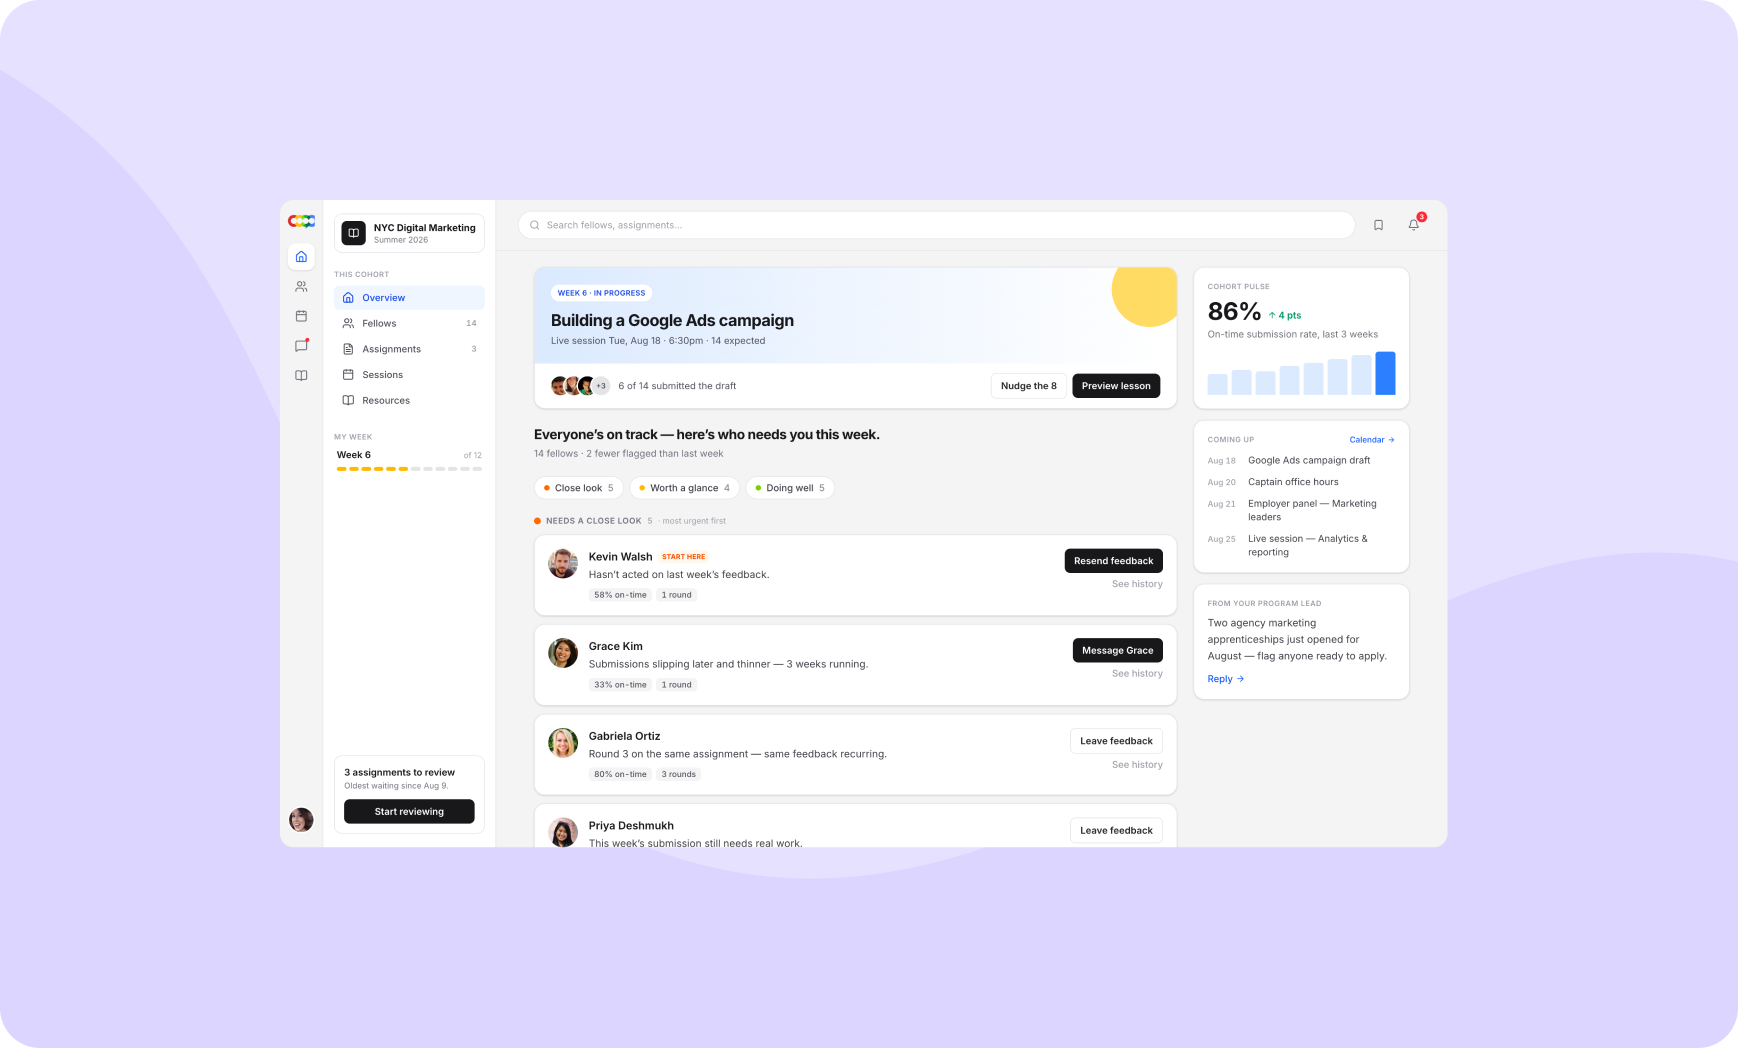
For this project, I set out to design an internal dashboard for COOP teachers, or “Captains”: one place to access curriculum, resources, and community during the fellowship.
Working from stated assumptions
Since I don't yet have access to COOP's captains, I made my assumptions explicit and designed against them, so they can be tested and corrected rather than buried.
Captains are part-time alumni with a few hours a week. Their attention is the scarce resource. This is the assumption the entire design rests on, and the first thing I'll validate.
Cohort size is around 15
The week is fixed: session, assignment released, submissions due, captain reviews, feedback returned
Captains acknowledge every submission but can only go deep on a handful
How I set up AI to work with me
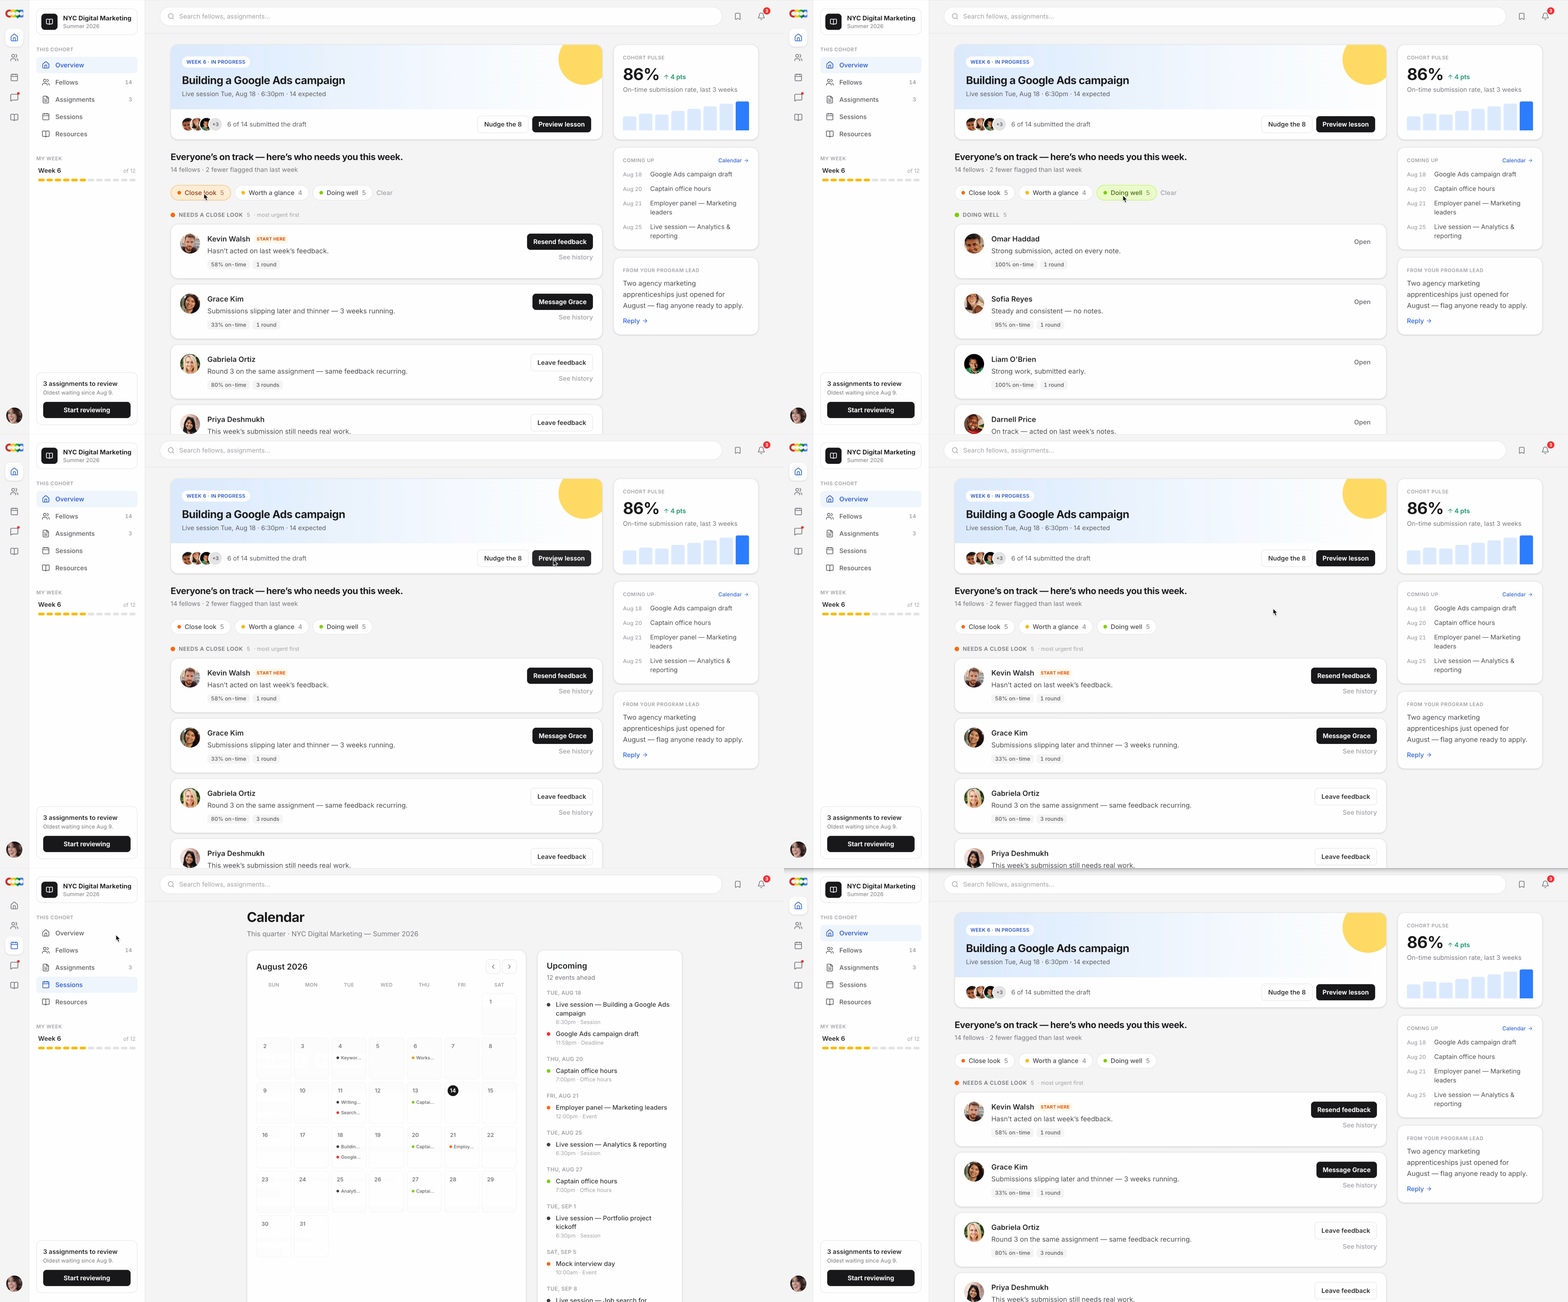
COOP currently has no engineering capacity, and they're waiting on a volunteer program for developers. This is why building in code mattered, because the concept can be tested with captains before anyone writes production code. Before generating anything, I wrote a context file defining the domain, the states, my assumptions, and the constraints. That file is where the design thinking happens, Claude Code will produce something plausible from a vague prompt, but specifying the states and edge cases is what makes the output useful. From there I built a working prototype in Claude Code and deployed it to Netlify.
Next steps
My next steps will include research rounds with two or three captains, testing one thing specifically: does the order the dashboard proposes match the order a captain would actually choose? I also used Claude to draft the research plan for next week's sessions with captains. I gave it my assumptions and asked it to write questions that would test them then cut about half, because several were leading or would have gotten me the answer I was hoping for.
The prototype also uses mock data, so the open question is what COOP's systems can actually supply. The triage logic depends on signals like submission timing, revision counts, and engagement over time. My next step with the tech team is mapping each one to its real source, and adjusting the design where the data isn't there.